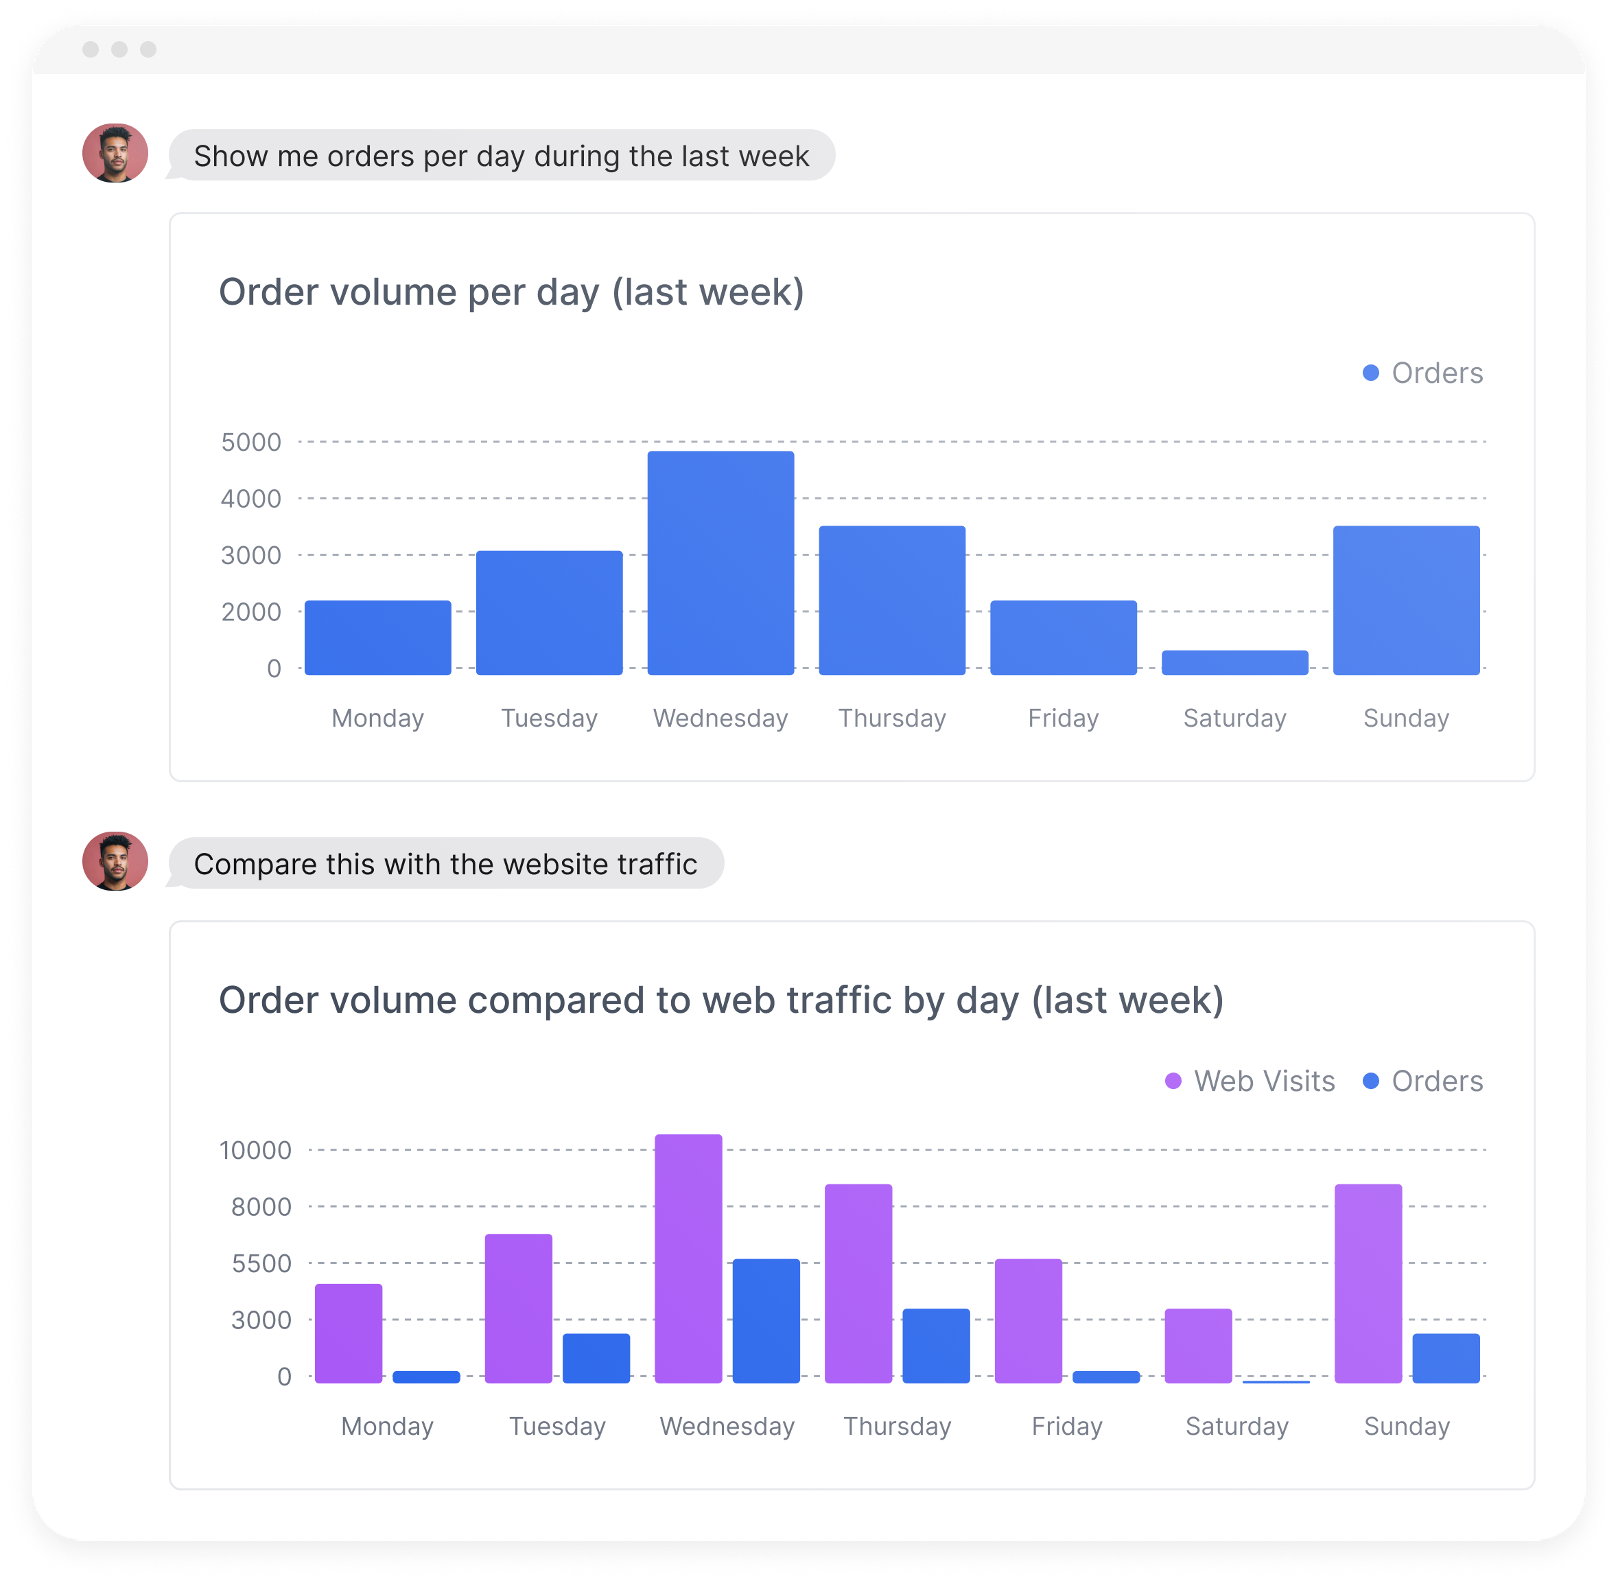
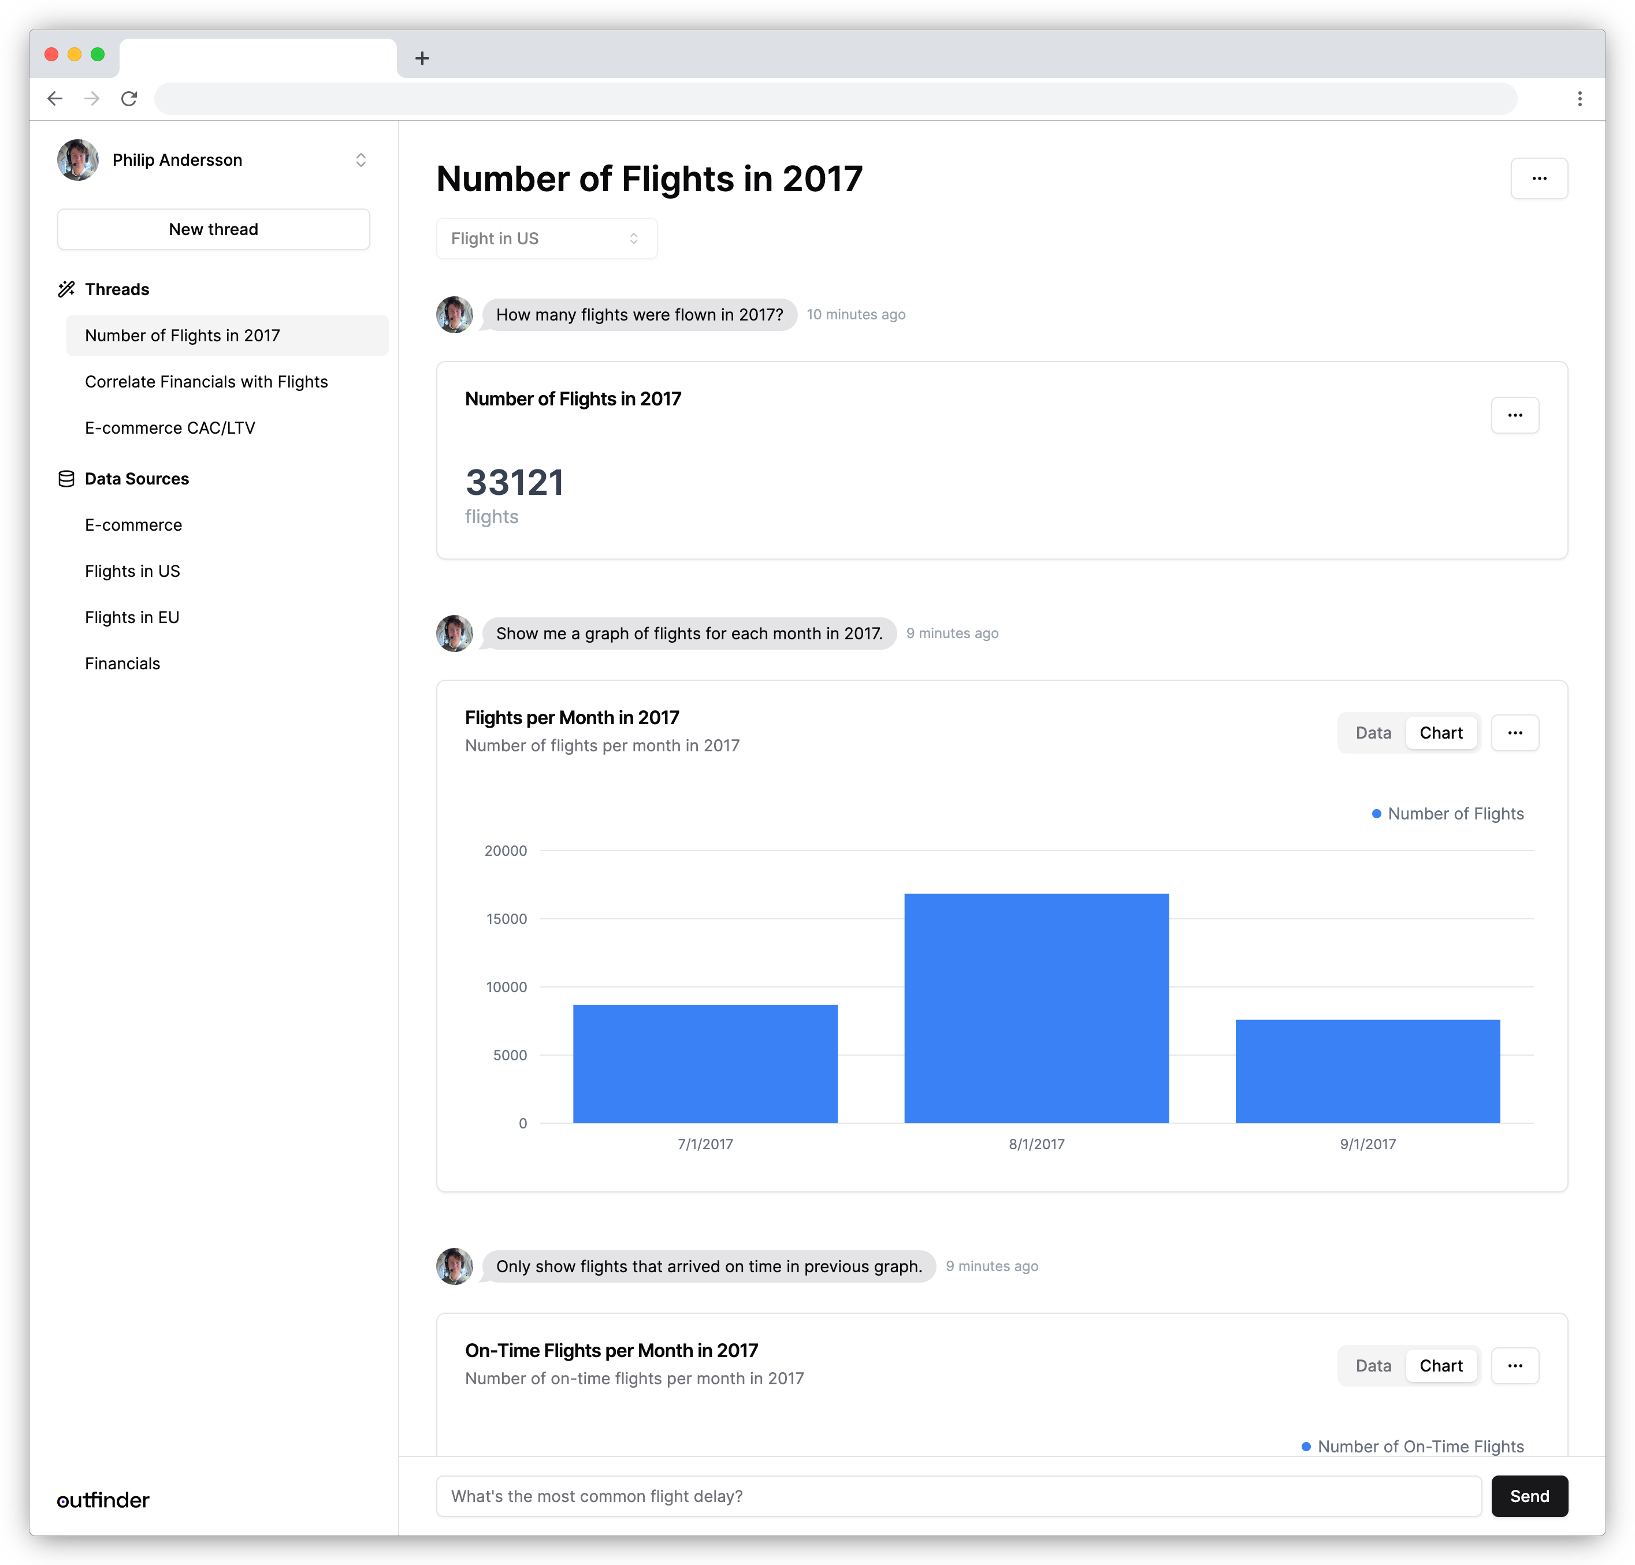
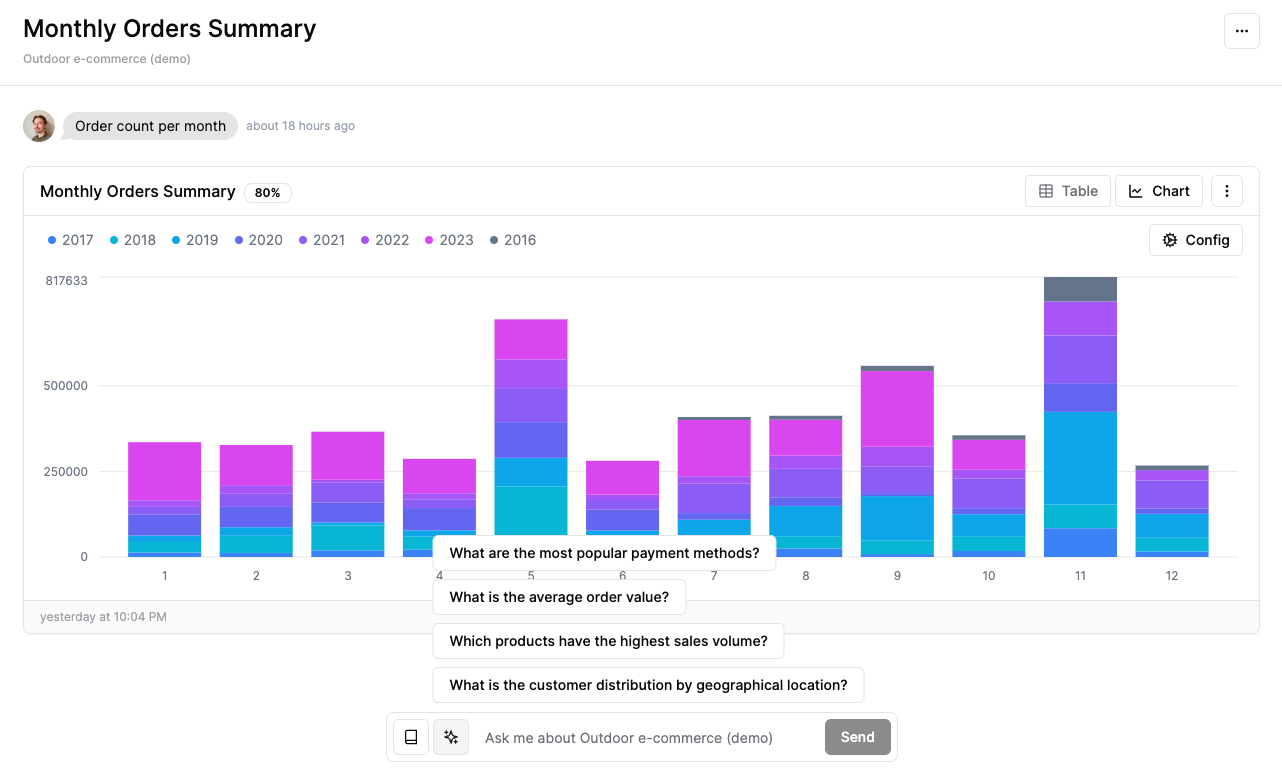
Ask your data and discover insights. With plain text.

Compiling yet another data report by hand? Or you don't remember where or how to find the data you are looking for? Or maybe you need help from a data analyst to access and transform your data ? Just ask outfinder to do it for you - We turn your questions into to data queries and visual insights.

In product image

Watch the demo

See the demo of outfinder private alpha 

Pricing

  • Starter

    Getting started
    $
    19
    /month
    $
    /year
    Per user
    • ✓
      10 insights/month
    • ✓
      1 workspace
    • ✓
      1 data source
    • ✗
      Verified queries
    • ✗
      Dashboards
    • ✗
      Automations
    • ✗
      Auto-discover insights
  • Pro

    For growing teams
    $
    79
    /month
    $
    /year
    Per user
    • ✓
      30 insights/mo
    • ✓
      1 workspace
    • ✓
      3 data sources
    • ✓
      Verified queries
    • ✓
      Dashboards
    • ✗
      Automations
    • ✗
      Auto-discover insights
  • Enterprise

    For bespoke needs
    Custom
    Per company
    • ✓
      Insights
    • ✓
      Unlimited workspaces
    • ✓
      Unlimited data sources
    • ✓
      Verified queries
    • ✓
      Dashboards
    • ✓
      Automations
    • ✓
      Auto-discover insights

Your personal data assistant

Genereting actionable insights
from your data have never been easier.

  • Frame chrome mac light
  • Screenshot 2023 11 29 at 15.54.57
  • Frame chrome mac light (2)

Features

  • 🤖

    Natural Language AI

    Our AI uses a cutting edge technqiue called Natural Language Query (NLQ) to translate your questions to SQL that your database understands.

  • 💽

    SQL Databases

    We support the biggest SQL databases including but not limited to Postgres, MySQL/MariaDB, BigQuery and ClickHouse.

  • 🗂️

    Workspaces

    Use workspaces to share the insights you derive with your colleagues or friends.

  • ☑️

    Verified Queries

    The more you use it, the better it gets. With verified queries you can boost accuracy by providing feedback to the AI.

  • 💻

    Dashboards

    Put the insights you've found in a dashboard to make it easily accessible when you want to revisit them

  • 📊

    Charts

    The data is shown in the way we think is most digestible! If you don't agree it's tweakable to your preference, one click away

  • 💡

    Suggested Questions

    When in doubt, use a suggested question to continue exploring your data without having to write one yourself.

  • 🎯

    Confidence Scoring

    All results are evaluated and scored against you to trust your data. By providing business context we can filter insights based on data quality.

Brought to you by

  • Image (1)
    Philip
  • File name
    Eric

Get early access

Error. Your form has not been submittedEmoji
This is what the server says:
There must be an @ at the beginning.
I will retry
Reply
Built on Unicorn Platform